AI Dashboard Generator: Finally, See Your Business Clearly.
Stop drowning in spreadsheets and clunky reports. Our AI converts complex data into beautiful dashboards in seconds—so you get answers and enter meetings with confidence.
No credit card required















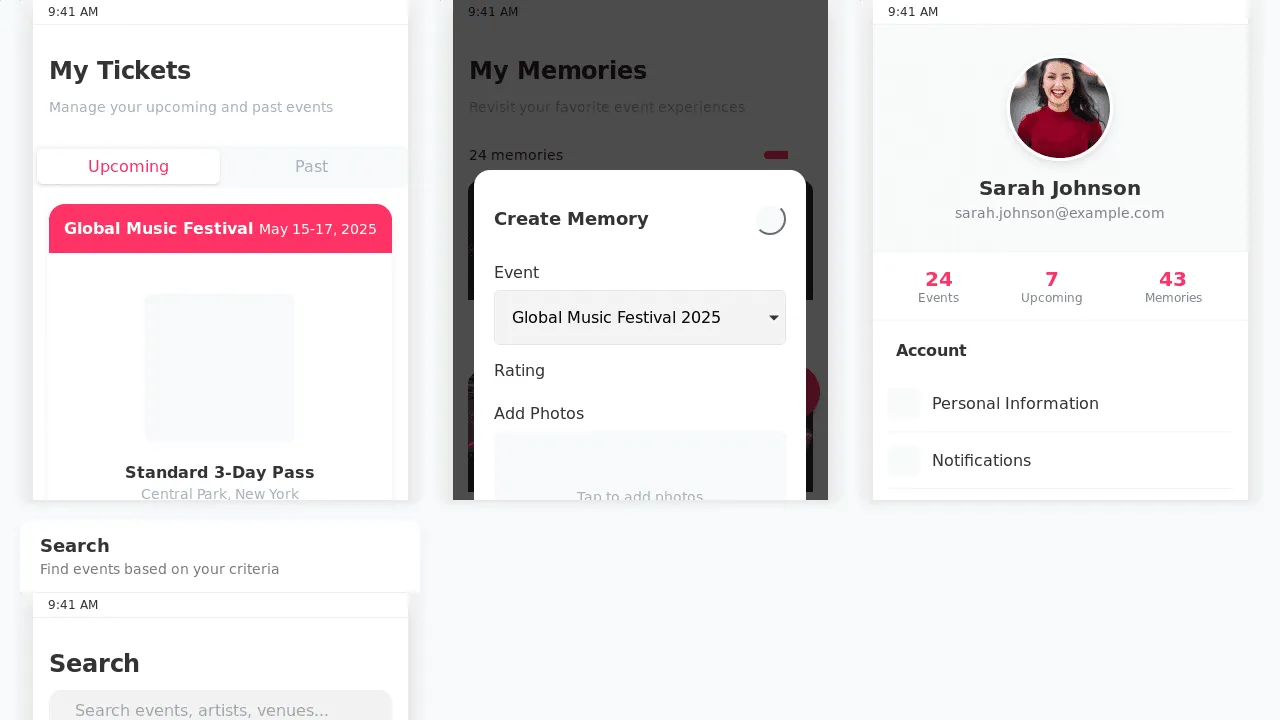

Live Rendering
Instant updates with images, branch support, undo at any step and one click deploy
Elegant Design
Built‑in templates and guidelines for refined interfaces
Multi‑Agent Workflow
Agents debate and refine plans before generating reliable code
Supabase Backend
Natural language to schemas and APIs without manual setup
Visual Editing
Select elements, describe changes and apply precise updates








How to build
Pricing
Free to start. Flexible to scale.Frequently Asked Questions
See our Help Center for more info
Build Your First Dashboard Now
Stop Managing Spreadsheets. Start Leading with Insight.
Effortlessly Build AI Dashboards with Our Generator
Discover the future of data visualization with our groundbreaking tool. Our ai dashboard generator simplifies complex analytics into a user-friendly experience. Anyone can now create stunning business insights with ease.
No more technical expertise needed to create dashboards that impress your audience. This AI-powered platform puts professional tools at your fingertips. Turn raw data into compelling visual stories, regardless of your business size.
Intelligent automation handles the complex work for you. Our system makes dashboard creation accessible to everyone. Input your data, and watch as beautiful, interactive displays are generated instantly.
This technology is a game-changer for businesses everywhere. Say goodbye to IT department delays and expensive consultants. Create the analytics tools you need right now, on your own.
Key Takeaways
- Create professional dashboards without any technical expertise or coding knowledge
- Transform raw business data into stunning visual representations automatically
- Access enterprise-level visualization tools through a user-friendly platform
- Save time and money by eliminating the need for specialized technical staff
- Generate interactive displays that effectively communicate insights to any audience
- Scale your analytics capabilities from small business to enterprise level seamlessly
What Makes AI Dashboard Generators Essential for Modern Businesses
Companies rely on data-driven decisions, but getting useful insights is tough. Digital info has created chances and problems for firms tracking their performance. AI dashboard generators are changing how businesses handle data visualization.
Old ways of showing data often frustrate teams and cause delays. Smart automation is making analytics easy for everyone, not just tech experts.
The Challenge of Traditional Dashboard Creation
Making good dashboards the old way is hard for most businesses. Teams often spend months on simple charts that should take hours.
The main problem is needing to code. Most dashboard tools require tech skills many business users don't have. Leaders often depend on IT for basic reports.
Dealing with complex data from many sources adds more trouble. Different systems don't work well together. This creates info gaps that limit smart business choices.
Time makes things worse. By the time old dashboards are ready, business has changed. Fast-moving markets make outdated data analysis less useful.
How AI Transforms Data Visualization
AI changes how firms make dashboards and handle BI tasks. When you use an AI dashboard generator, hard jobs become easy for anyone.
AI removes tech barriers. It makes charts and graphs without coding. This lets everyone in a company use data easily.
Smart systems suggest the best ways to show your data. Good AI tools learn what you like and make info clear and powerful.
Real-time updates keep dashboards current with live business data. Leaders always have fresh insights on market trends and company performance.
AI makes connecting different data sources simple. It creates complete views that used to need lots of setup and upkeep.
Transform Complex Data into Actionable Insights Instantly
AI dashboard generators turn overwhelming datasets into clear, visual narratives. They bridge the gap between data collection and meaningful analysis. This technology removes barriers to understanding complex information.
Modern AI tools create polished visualizations faster than ever before. This speed gives businesses a competitive edge. Companies can now quickly turn scattered data into useful insights.
From Raw Data to Interactive Dashboards in Minutes
Upload your dataset, and the AI analyzes it instantly. It suggests the best ways to present your information. Interactive dashboards appear automatically with filters and drill-down options.
Users simply drag and drop files to start the process. The AI recognizes patterns and creates meaningful visualizations. No tech skills are needed to generate dashboards that rival professional work.
The best dashboards tell a story with data, not just display numbers on a screen.
Real-time processing delivers insights as soon as data is uploaded. Teams can make informed decisions quickly. This beats waiting weeks for traditional dashboard development.
Connecting Multiple Data Sources Seamlessly
AI dashboard generators excel at bringing different data sources together. They connect sales, financial, and marketing data from various platforms. This happens automatically through secure connections.
Users can link different data sources without coding. Real-time updates keep all information current. This creates a complete view of business performance.
The data dashboard becomes a single source of truth. Teams can see how different departments affect overall company success. This comprehensive view helps make better decisions.
Automated Chart Generation and Visualization
AI selects the best chart types for your data. It considers data types, relationships, and audience to make smart recommendations. This removes the guesswork from data visualization.
Advanced algorithms suggest chart combinations that reveal hidden insights. Users can accept these or customize them further. The system creates bar charts, line graphs, and more for maximum impact.
- Automatic chart type selection based on data characteristics
- Smart color schemes that enhance readability
- Responsive layouts that work on any device
- Interactive elements that encourage data exploration
Natural language processing lets users ask questions about their data in plain English. The AI creates appropriate visualizations instantly. This makes complex ai data analysis accessible to everyone.
Why Our AI Dashboard Generator Outperforms Traditional Tools
Our AI dashboard generator transforms how teams use data. It makes dashboard design easy for everyone. You can transform data into stunning visuals without complex interfaces or lengthy learning.
Traditional tools have many menus and settings. Our AI approach focuses on turning your data source into actionable insights for business decisions.
Speak Your Vision Into Reality
Our technology understands what you want to create. Describe the dashboard you need in plain English. The AI models will generate the perfect visualization.
Say things like "Show sales trends by region" or "Compare marketing channels." The system builds charts and graphs instantly. This removes the learning curve of traditional tools.
Live Data That Never Sleeps
Real-time updates set us apart from static solutions. Visualizations refresh as new data flows from your data source. Every metric stays current without manual work.
Our system keeps live connections for accurate images of dashboard. Teams can decide based on the latest info, not old numbers.
AI-Powered Recommendations
Our smart engine suggests the best visualization types. It analyzes data patterns and offers optimal chart choices. You get pro-quality results without needing expert skills.
The AI considers data volume, variable relationships, and industry best practices. This helps create effective dashboard design with maximum impact.
Share Success With One Click
Sharing becomes easy with our instant dashboard features. Create secure links, embed visuals, or export dashboard mockups in one click.
Our simple approach lets you build dashboards and share them right away. Teams can access live data and actionable insights from any device.
Key Features That Simplify Dashboard Creation Process
Creating professional dashboards is now easier than ever. Our AI dashboard generator combines powerful functionality with intuitive design. It works with Google Sheets, CSV files, and complex databases.
Modern dashboard tools automatically generate professional results. Users can turn data into actionable insights efficiently. These features are designed for simplicity and effectiveness.
Drag-and-Drop Interface for Easy Customization
The drag-and-drop interface simplifies dashboard creation. Select data elements and drag them into position on your canvas. You can build professional dashboards in minutes with this intuitive approach.
Customization is effortless with simple mouse movements. The interface provides real-time previews of your dashboard layout. No coding knowledge required – just point, click, and create.
- Instant chart positioning and resizing
- Real-time layout previews
- Seamless widget arrangement
- One-click element duplication
Pre-Built Templates for Common Use Cases
Pre-built templates speed up your dashboard creation process. Our library covers common business scenarios, from sales tracking to financial reporting. Each template is professionally designed and fully customizable.
These templates work well with Google Sheets and CSV imports. You can adapt any template to your specific needs. They're great starting points, even for users switching from Power BI.
Popular template categories include:
- Sales performance and revenue tracking
- Marketing campaign analytics
- Financial reporting and budgeting
- Project management and team productivity
- Customer service and support metrics
Advanced Analytics and KPI Tracking
Advanced analytics turn your dashboards into powerful decision-making tools. The system calculates key performance indicators automatically. Your most important KPIs are clearly visible through smart data processing.
Real-time analytics keep your dashboards up-to-date. The platform updates your graphs and metrics as new information arrives. This dynamic approach helps your team respond to changing situations quickly.
Key analytics features include:
- Automated KPI calculations and trending
- Predictive analytics and forecasting
- Custom metric creation and tracking
- Comparative analysis across time periods
- Alert systems for threshold monitoring
These features make dashboard generation powerful and accessible. You don't need technical expertise to create stunning visualizations.
Real-World Applications Across Industries and Teams
AI dashboard generators shine in various industries. They solve real challenges by connecting data through intelligent visualization tools. Every department can unlock insights that drive better decisions.
These ai tools adapt to diverse business needs. They transform complex information into clear, actionable insights. From sales performance to supply chain efficiency, the platform covers it all.
Business Intelligence and Performance Monitoring
Business intelligence teams use dashboards to track company-wide metrics. They need to analyze your data from multiple departments quickly. The dashboard generator offers advanced analytics capabilities.
Teams can monitor key performance indicators in real-time. Revenue trends and efficiency metrics become instantly visible. Executive dashboards show critical business health indicators at a glance.
Sales rates, market share, and competitive analysis merge into unified views. Decision-makers access information without waiting for manual reports.
Marketing Campaign Analytics and ROI Tracking
Marketing teams need to prove campaign effectiveness and optimize spending. Traditional reporting often lags behind fast-moving campaign cycles. Modern marketers require immediate access to performance data.
Campaign dashboards track multiple channels at once. Social media, email, and website conversions appear side by side. Marketers can analyze data from various platforms in one interface.
ROI calculations become automatic with integrated cost and revenue data. The system instantly calculates customer value and acquisition costs. Teams can see which channels deliver the highest returns.
Financial Reporting and Budget Management
Finance departments handle sensitive data requiring accuracy and security. Visualizing data through automated dashboards reduces reporting time significantly. Budget reports update automatically as new transactions flow through.
Department heads can monitor spending against approved budgets. Cash flow projections adjust based on current trends. Compliance reporting streamlines when financial data connects to regulatory templates.
The entire dashboard creation process maintains data integrity throughout. Audit trails remain intact while presenting digestible information.
Operations and Supply Chain Visualization
Operations managers juggle inventory, production schedules, and supplier performance daily. Real-time visibility prevents small issues from becoming major problems. Inventory dashboards show stock levels across multiple locations.
Reorder points trigger automatically based on demand forecasts. Supplier metrics highlight delivery delays and quality issues quickly. Production efficiency dashboards track machine utilization and downtime patterns.
Quality control metrics identify trends indicating equipment problems. These use cases show how operational teams maintain smooth workflows.
| Industry Sector | Primary Dashboard Use Cases | Key Metrics Tracked | Business Impact |
|---|---|---|---|
| Healthcare | Patient flow monitoring, resource allocation | Bed occupancy, staff utilization, patient satisfaction | Improved patient care, reduced wait times |
| Retail | Sales performance, inventory management | Revenue per store, stock turnover, customer traffic | Optimized inventory, increased profitability |
| Manufacturing | Production monitoring, quality control | Output rates, defect percentages, equipment efficiency | Reduced downtime, improved quality |
| Education | Student performance tracking, resource planning | Enrollment trends, graduation rates, budget allocation | Better student outcomes, efficient resource use |
Dashboard ai uses extend across every business function. Teams create professional visualizations in minutes, overcoming data complexity. Organizations now realize powerful analytics don't require technical expertise.
Getting Started: From Data Upload to Dashboard Deployment
Transform raw data into visual insights with the AI dashboard generator. It's a simple process for both experts and beginners. The platform makes dashboard creation intuitive and rewarding.
Start by connecting your information sources. Upload your data from various formats and locations. AI then suggests the best ways to display your information.
Importing Data from Google Sheets, CSV, and Databases
Connecting to your data source is quick and easy. The platform supports common business data formats. Import information directly without complex technical setup.
Here's how to get your data connected:
- Google Sheets: Simply paste your sheet URL or grant access permissions
- CSV Files: Drag and drop files directly into the upload area
- Databases: Use secure connection strings for MySQL, PostgreSQL, and other systems
- Cloud Storage: Connect to Dropbox, OneDrive, or Amazon S3 buckets
The system detects data types and formats automatically. Work with data without spending hours on preparation. AI handles most formatting issues behind the scenes.
Selecting the Right Visualization Types
After data loads, the platform analyzes patterns and relationships. The AI suggest visualization types that best represent your information. This saves time and ensures optimal data presentation.
The system considers several factors when making suggestions:
- Data types and relationships between columns
- Volume of information and complexity levels
- Industry best practices for your data category
- Interactive features that enhance user engagement
You're not limited to AI recommendations. Choose from dozens of chart types, from basic graphs to advanced maps. Each visualization updates in real-time as you make selections.
Customizing Dashboard Design and Layout
Make your new dashboard reflect your brand and audience needs. Adjust colors, fonts, and layouts without design experience. The AI builds a foundation you can fully personalize.
Key customization options include:
- Color schemes: Match your brand colors or choose from professional palettes
- Layout templates: Select from grid, flowing, or custom arrangements
- Interactive elements: Add filters, drill-down capabilities, and hover effects
- Mobile optimization: Ensure dashboards work perfectly on all devices
Use the drag-and-drop interface to position elements easily. Resize charts, move components, and adjust spacing with mouse clicks. Preview mode shows how your dashboard will appear to users.
Sharing and Collaborating on Your Dashboards
Share dashboards securely while enabling collaboration. Control who sees what information and how they interact with your data. Multiple sharing options maintain security and flexibility.
Sharing methods include:
- Direct links: Send secure URLs to specific team members
- Email invitations: Invite colleagues with customized access levels
- Embed codes: Place dashboards directly in websites or applications
- PDF exports: Generate static reports for offline sharing
Collaboration features allow effective teamwork. Add comments, suggest changes, and create custom views of shared data. The platform tracks changes and maintains version history.
Permission settings ensure data security. Grant view-only access, editing rights, or administrative control. Each user sees only authorized information. Create interactive dashboards that serve different stakeholder needs easily.
Best Practices for Maximizing Your Dashboard's Impact
Smart practices turn raw data points into actionable business intelligence. Our powerful AI creates dashboards in minutes. Proven strategies ensure your visualizations deliver maximum value to your team.
These best practices act like a data expert by your side. They guide you towards better functionality and user experience. The right approach transforms unused dashboards into drivers of business outcomes.
Selecting Meaningful Metrics and Performance Indicators
Choose metrics that matter to your audience. Focus on key performance indicators linked to business goals. Avoid displaying every available data point.
Identify decisions your dashboard users need to make. Sales teams might prioritize conversion rates. Operations teams may focus on efficiency metrics.
Use the "5-second rule" for dashboard design. Users should grasp the main message quickly. Limit primary metrics to 5-7 key indicators.
Enhancing Speed and Responsiveness
Dashboard performance affects user adoption and satisfaction. Slow-loading visualizations frustrate users and reduce usage. Optimize your data structure by aggregating information before visualization.
Pre-calculate summaries to display data more efficiently. Use caching features and incremental updates. Many platforms offer free plans with optimization tools.
Implementing Robust Security Measures
Protect sensitive information with careful access controls. Establish clear user roles aligned with your organization's security policies. Create tailored access levels for team members.
Conduct regular security audits to maintain data integrity. Review permissions quarterly as team structures change. Balance accessibility with security in your dashboard design.
Make information easy to find for authorized users. Maintain appropriate barriers for sensitive data. This approach ensures both usability and protection.
Revolutionizing How Teams Work with Data and Analytics
AI dashboard generators are changing how organizations handle data. They make data access easy for all departments and skill levels. Teams no longer struggle with complex spreadsheets or wait for technical support.
Employees can now create interactive dashboards from multiple data sources. This new ability makes the entire organization more adaptable. Marketing teams can track campaigns in real-time. Sales departments can instantly check pipeline health.
This technology simplifies data analysis for everyone. A single platform can summarize dashboards from various departments. Leadership gains comprehensive insights from each dashboard created.
These dashboards provide immediate value when teams upload their data. Natural language processing handles the complex technical work behind the scenes. The learning curve disappears, making data exploration easy.
Organizations using AI-powered visualization tools gain a competitive edge. They empower every team member to work with data confidently. Your data holds untapped potential waiting to drive your next breakthrough.
FAQ
What is an AI dashboard generator and how does it work?
An AI dashboard generator turns raw data into interactive dashboards without coding. Upload your data from various sources like Google Sheets or CSV files. The AI analyzes your data and suggests effective visualizations.